

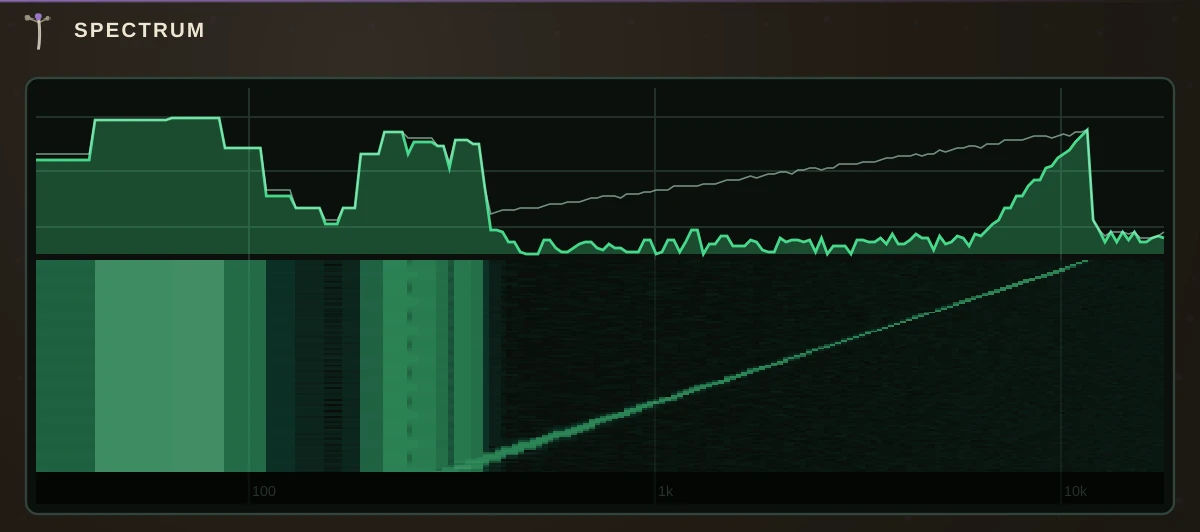
The analyser window: what the signal is made of, drawn live. The upper pane is the spectrum right now - a curve over frequency with a faint peak-hold line remembering the loudest each band has been - and the lower pane is the waterfall: the same spectrum smeared through time, newest at the top, so a filter sweep draws a curve and a kick drum stamps a bass stripe you can read a bar later.
The audio passes through completely untouched, so it can sit on any cord. There is nothing to set: the instrument is calibrated once and simply read.
Reading it
Frequency runs left to right on a log scale, 30 Hz to 18 kHz, with the decades marked - bass lives in the left third, presence and air on the right. Height and brightness are level, floor at -72 dB. Two sounds fighting show as ridges in the same place; a sweep shows as a moving peak; hiss shows as a floor that never goes dark.
Sleeping
In silence the analyser freezes - the waterfall holds its last picture and the window costs nothing until signal returns.